WOMEN AIRFORCE SERVICE PILOTS (WASP)
RISKING LIFE IN SERVICE TO THEIR COUNTRY

(Copyright © CAHailey, 2003, All rights reserved, Request Permission to Use)

Page available since 3/9/2003 - last updated 3/6/2008

INTRODUCTION:
The basic subject of this research is WASP training accidents. However, what is important to keep in mind is the context in which these accidents occurred and the fact that these women were risking their lives. They were climbing into flying machines based on a technology that had just turned 40 years old- not much older than the average age of these women pilots - and a technology that was in the midst of rapid change. Think of it this way, even with a commercial pilot license, how risky would it be to fly the newest developmental fighter or stealth bomber?
The basic subject of this research is WASP training accidents. However, what is important to keep in mind is the context in which these accidents occurred and the fact that these women were risking their lives. They were climbing into flying machines based on a technology that had just turned 40 years old- not much older than the average age of these women pilots - and a technology that was in the midst of rapid change. Think of it this way, even with a commercial pilot license, how risky would it be to fly the newest developmental fighter or stealth bomber?
|
First a little historical perspective. Only 25 percent of all women earned money in 1940 and only 15 percent that were married worked. They averaged $850 per year. Getting a pilots license could cost $750. For a wife who didn't work, the husband would have to allot half of his annual salary to pay for her playing with an airplane. What this meant was that those women who did fly were very independent and of independent means [8]. |
|
In spite of the situation then, a survey showed that there were about 2,000 women with less than 200 hours flying, 83 with more than 200 hours but less than 500, and only 50 with 500 or more hours. [8].
In late 1942, the United States was in the early stages of trying to win WWII. They needed, among many things, over 100,000 [9] pilots to go overseas and risk their lives and probably die to free Europe and to keep invaders from bringing the war to our western shores. The government needed as many men as possible flying overseas combat missions in a variety of fighters and bombers. However, at the same time, pilots were also needed to ferry new planes from the factories and help train troops. While the generals were doing their best to get all this done, a couple of women, Nancy Love and Jackie Cochran, decided they could organize women pilots to help support the work stateside. This would free up hundreds of male pilots to go overseas and increase the likelihood of winning the war.
Nancy and her group of 28 women got into the effort first. They are know as "The Originals", the Women Auxiliary Ferrying Squadron (WAFS). They were a very select group of women pilots with an average of over 1,100 hours of flight time with a minimum of 500 and a maximum of 3,200 for one. With 30 days training in the military way of doing things, these women were quickly off to various ferrying commands around the country. This was a good start, but 28 pilots was not enough. (My mother, Lois Hailey, had received an invitation from Nancy Love but did not accept.)
|
Jackie Cochran got approval to start her program at the same time in late 1942. In her case, however, the women pilots were not required to have as much flying time, and instead would receive from 23 to 30 weeks of training in the Women's Flying Training Detachment (WFTD). By December, 1944, this program had accepted 1,830 candidates and graduated 1,074 women pilots for ferrying, troop training, testing, administrative, other flying jobs across the United States. Nine hundred and sixteen of these women were on active duty when the WASPs were disbanded in December, 1944.
In the summer of 1943, the WAFS and WFTDs were combined into the Women Airforce Service Pilots (WASP). WASP duties varied considerably from ferrying thousands of new aircraft to flying training missions in old war torn planes. These women flew all the same planes the men did, including pursuit planes like the P-51 and P-63, and bombers like the B-17, B-25, and B-29. |
|
RISKING THEIR LIVES:
All flying comes with risk, especially when the technology is young and changing fast. For the WASP, first came learning to fly the Army way. After that, came even higher risk in the ferrying squadrons, troop training of all sorts, and operations support. The WASP flew the new planes right out of the factory that had never been flown before,
All flying comes with risk, especially when the technology is young and changing fast. For the WASP, first came learning to fly the Army way. After that, came even higher risk in the ferrying squadrons, troop training of all sorts, and operations support. The WASP flew the new planes right out of the factory that had never been flown before,
|
some with reputations as killers. Sometimes they had to learn to fly these planes on their own from the flight manual and an introduction to the cockpit. They flew war torn used aircraft with questionable reliability that should probably have been scrapped but were used for combat training like towing targets for weapons training from machine guns to 90mm cannons. The WASP also were used for various operational activities including the weather wing, post maintenance testing, cargo delivery, engineering/test, administrative flying, etc.
|
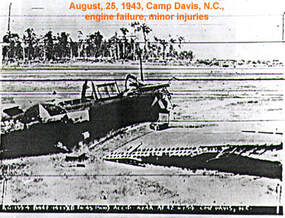
Here's what Lois B. Hailey had to say about the risks at Camp Davis, N.C., while in tow target training. "The Navy equipment we were using had been worn torn out in Pacific flying, and we would have many landing gear and some engine failures. We did not have the high octane [100] gas required for the A-24 and A-25 and using a lower octane [90] may have been the source of some troubles. One of our group Mabel Rawlinson was killed in our first night checkout flying."
The Safety pilot on the flight with Mabel was Harvey 'Robi' Robillard. In a letter written from his wife [10], she reported that he said that the planes they were assigned were junk, not fit to fly.
Other factors contributed to the risk these women took. These included plane ergonomics, they weren't built for women, instructor attitude, and instructor experience
During their support of the war effort, 38 WASP were killed, 7 suffered serious injury, 29 suffered minor injuries, and 359 were involved in accidents without injury but with damaged planes. This does not include other accidents that didn't result in plane damage. For instance there is what was referred to as "unintended caterpillars". These were trainees in open cockpit planes that were not properly fastened into their seats and became separated from their plane during flight. Their parachutes proved quite important during their unplanned fall back to earth.
During WASP training, there were eleven fatalities, two suffered major injuries, ten had minor injuries, and 190 other pilots suffered no injury.
These women put their lives on the line. They weren't in combat, but they risked injury and death for over 780 days during WWII. And that risk increased significantly after completing WASP training. Twenty-seven died after training, but that will require additional research and is not expanded on here except to contrast known numbers with those from training.
SCOPE:
The results presented here include the accidents summarized in a 1945 Army Airforce report [7]. The results also include a couple of other accidents that were discovered during this research that were not in the report. One accident from the summary report was removed after it was discovered that the pilot listed was an instructor.
The results presented here include the accidents summarized in a 1945 Army Airforce report [7]. The results also include a couple of other accidents that were discovered during this research that were not in the report. One accident from the summary report was removed after it was discovered that the pilot listed was an instructor.
|
These accidents include those that occurred during training in Houston and in Sweetwater, Texas, and those that occurred during active duty across the country. The results presented center around the training accidents, but details on active duty accidents are included to provide some perspective on the risk these women were taking. Differentiating training and active duty accidents was possible due to of the data items contained in the 1945 Army report called Mission. One of the mission codes is Student Training (ST). It should be pointed out that ten ST categorized accidents occurred after WASP graduation and thus are included in the active duty accidents for this study.
Included in this study are 213 accidents involving 204 of the 1,830 trainees. These trainee accidents and an estimated training time were tabulated on a week-by-week basis with the goal of determining an accident rate as a way of measuring the risk the WASP took and how that risk varied over time. |
|
TABULATING ACCIDENT DATA AND THE WASP TRAINING SCHEDULE:
The training curriculum seemed reasonably well defined. There were graduation dates, numbers of students starting and graduating for a given class and summaries in a couple publications, [1] and [4], that provided the hours for various training, flying, ground school, and simulator. However, these data were not sufficient for a class-by-class week-by-week analysis. With some trial and error, and using available data, as explained later, to compare with the results of this analysis, a reasonable schedule for each class was determined.
As such, a reasonable schedule will not provide exact accident rates for a given week or a given class, but it will provide a means of comparing groups of data to each other. In other words, comparing WASP trainees to active duty WASP should be fairly meaningful, but comparing one week of one class to the same week of another class won't necessarily be as meaningful or for that matter even useful. Also, comparing all classes in one phase of training to all classes in another phase of training should provide some insight into how risks might have changed during training. However, comparing one class to another during a particular training phase is less revealing or useful.
As data were tabulated, some were compared via multiple layouts of the data to minimize errors. For example, the accident data were grouped three ways; all, training only, and active duty only. Also, the training hours were tabulated in two ways; cumulative across the class schedule for those trainees still in training for a given week, and as a total for all trainees that participated for any time during the program. In other words, there were the hours at a given point in time for a given class of trainees, and there was the total time in training for all trainees regardless of whether they graduated. For example, those pilots who graduated completed about 660,000 hours, while all trainees for the complete program completed around 900,000 hours of training.
|
The schedule data, training hours, and numbers of students, were laid out as described below and adjusted to fit other documented data. For example, the maximum number of WASP trainees reached 523 in early March, 1944, with the graduation of class 44-2. In addition, copies of some accident reports were obtained to help determine details like what phase of training did the accident really occur in.
The results presented here are based on all known accidents, not just injuries or fatalities, and all hours of flight or related training such as ground school. Keep in mind that these hours do not include every hour spent during the day. For example, they don't include physical training hours or hours waiting on the flight line for a turn in the next available plane. |
Accident Data:
Key accident data tabulated for this research are from the 1945 accident report summary [7] and from multiple official Army accident reports [6]. The data from the 1945 report were captured in a spreadsheet as were the WASP rosters of graduates and trainees. These two files were sorted by name and compared. The full names and class information from the roster file were inserted into the accident file. This helped to verify the accident report contents and to identify and correct errors in both the accident report and class rosters.
Using the mission code in the 1945 report, the accident list was duplicated/separated into training and active duty. Only those training accidents associated with Houston and Sweetwater were included in the training list. Those training accidents, ten in number, that occurred after graduation were not included.
Inserting these data into a spreadsheet enabled accurate extraction of information such as accidents or injury type for a given aircraft. It also allowed for fine tuning the data by determining the training phase in which the accident occurred.
Training Schedule:
Another spreadsheet was created to lay out the training schedule, student distribution, and training hours for each class. The class start dates were not conveniently documented and were determined from multiple sources. The graduation dates were already well defined and easily obtained.
Another spreadsheet was created to lay out the training schedule, student distribution, and training hours for each class. The class start dates were not conveniently documented and were determined from multiple sources. The graduation dates were already well defined and easily obtained.
|
References 2 and 3 provided most of the start date information and references 1 and 4 provided some start dates. For ten classes, three or more matching/similar start dates were found for each class. For the other 8, two references for the start date were found for each class.
The resulting start dates were loosely correlated against the graduation dates and the documented class length provided in references 1 and 4. By starting with the graduation date, using calendars for the appropriate year and counting backwards the published number of weeks in training, a start date could be confirmed. However, this showed that what was published in a plan didn't necessarily happen. For example, the first class was supposed to be completed in 16 weeks [4], but according to the documented start date, this class actually took 23 weeks. Inclement weather in Houston may have been a contributing factor. |
|
Distribution of Students:
Determining the distribution of students on a week by week basis became the most challenging aspect of this effort and required multiple iterations and overlaying of other data such as accidents, training phases and other related documented data.
One piece of related data was the stated maximum number of students in training: "the high point ... of the number of cadets who were in training .. was reached at the graduation of Class 44-W-2, when 523 students called Avenger Field home." [4] Class 44-2 graduated on March 11, 1944.
|
The second piece of related information was an initial trainee dropout rate. Table Six of Appendix T in On Final Approach showed WASP training costs through August of 1943 by training phase. More importantly, the table showed the dropout rate between phases: 20 percent for primary, nine percent for basic, and just over two percent for advanced. This resulted in an overall dropout rate of almost 30 percent for the first few WASP classes. However, that was not quite high enough. The total dropout rate was 41 percent for all the classes through December, 1944. But at least this showed that the dropout rate was highest for primary and lowest for advanced, which also seems to be intuitively correct.
However, keeping the weekly total under the 523 peak still required some additional information overlay - training phases. As each phase ended, students were dropped from the program. If the phases were not properly timed, this total could be exceeded. |
By laying out the three phases of training on a week by week basis for each class and knowing that the maximum number of students could not exceed the 523 for March, 1944, the starting and ending of the training phases were initially determined. Using this and additional documented data, the phases of training and trainee distribution were fine tuned.
Using Training Phases to Fine Tune Student distribution:
The references used stated that there were three training phases - Primary, Basic, and Advanced and that the time span for each phase was equal [1] [4]. This equal distribution was overlaid onto each class schedule. Then an initial distribution of students by phase was added in. Initial results exceeded the 523 maximum. The phase time spans had to be adjusted to eliminate the excess.
Where possible these adjustments in training phases were confirmed. This was done by overlaying the training accidents across the training schedule. (The accident spreadsheet discussed above contains the dates of the accidents and the class for the student involved.) If an accident fell on either side of the transition from one phase to another, a copy of that accident report [6] was obtained to determine the training phase for that class and week.
|
In addition to fine tuning the beginning and ending of the training phases, a drop-out rate slightly higher that the one for Table 6 reference above was used. This resulted in a reasonable approximation of the training phases for each class and student distribution over time. Since it is an approximation, its utility is limited to the general sense and best used at higher levels such as totals by phase or for all classes as a group.
|
|
There are a couple of things to note about the distribution of students across the schedule. It includes all students who were dropped back to another class for various reasons and had to start again in a later class. What this means is that the total number of students starting each class exceeded the 1830 that were enrolled. There were 25 trainees that were dropped back and started over. The distribution also takes into account, the loss of the 11 trainees that were killed during training.
Something else worthy of note, but not surprising, is that the distribution from this research varied from the stated plan. For example, one class spent 12 weeks in primary training instead of the planned 10 and one spent 6 weeks in advanced training instead of the planned 8. This is also demonstrated with the schedule for class 43-3 below. The time spent in Advanced was half that of Primary or Basic.
Something else worthy of note, but not surprising, is that the distribution from this research varied from the stated plan. For example, one class spent 12 weeks in primary training instead of the planned 10 and one spent 6 weeks in advanced training instead of the planned 8. This is also demonstrated with the schedule for class 43-3 below. The time spent in Advanced was half that of Primary or Basic.
| Training Schedule for 43-3
(Back to Results) |
|||
|---|---|---|---|
| TRAINING | WEEKS | HOURS | |
| PHASE | DATES | TRAINING | TRAINING |
| Primary | January 15 to March 28, 1943 | 10.0 | 50 |
| Basic | March 29 to June 2, 1943 | 9.5 | 70 |
| Advanced | June 3 to July 3, 1943 | 4.5 | 50 |
| Based on student pilot logs for Lois Hailey. | 24.0 | 170 | |
Training Hours:
At this point, the accidents and number of trainees are distributed over the established training schedule. What remains for tabulation are the hours spent in training.
The training hours used for each class included the minimum number of hours required for entry into the program, the hours required for flight training (including instrument and night flying), ground school, military training, aero equipment, first aid, physical training, hours in the Link simulator.
(According to the December 17, 1943, issue of The Avenger [2] ground school consisted of the following starting with class 44-5: Engines and Propellers - 42 hours, Aircraft and Theory of Flight - 20 hours, Math - 20 hours, Physics - 24 hours, Navigation - 76 hours, Instruments - 18 hours, Weather - 50 hours, Morse Code - min 30 hours.)
The required training for all these categories changed over time as program requirements changed and the previous flying experience of the trainees dropped. In Appendix J of On Final Approach, it states that the last change, although only minor, was made in August, 1944. The documented numbers, [1, 4, 5], resulted in total training hours for each class, which varied from 455 to 850.
These total training hours were distributed evenly across the schedule for a given class even though that was not necessarily the case. This was done such that for a given week the number of hours represented the cumulative total hours up to and including the end of that week for a single student.
Accident Rates:
The end result of all this was the distribution of training hours as determined from the number of WASP trainees and hours trained each week, and a distribution of accidents over time. From this, accident rates could be calculated on a week by week basis, but used relative to the program as a whole or relative to training phases.
RESULTS:
The WASP trained and flew all the same planes that the men flew, from the smallest, PT-22, to the largest, B-29. And just like many activities involving the use of complex machines, there is a risk of accident, injury, and death. This was especially true of flying machines that were based on the latest in aviation technology and were either fresh from a factory or battle worn from WWII combat. Add to that the increased risk of mixing several hundred trainees at one location with minimal experience and the risks can be even higher.
The WASP trained and flew all the same planes that the men flew, from the smallest, PT-22, to the largest, B-29. And just like many activities involving the use of complex machines, there is a risk of accident, injury, and death. This was especially true of flying machines that were based on the latest in aviation technology and were either fresh from a factory or battle worn from WWII combat. Add to that the increased risk of mixing several hundred trainees at one location with minimal experience and the risks can be even higher.
|
The results presented here are about the WASP as a group. Occasionally, some items about a class are noteworthy in the context of a larger finding. But some results can be made more relevant by looking at them in terms of averages. For example, the average accident rate for all training hours and all students should be more relevant than the average for a given class on a given week where the devil is in the details.
|
|
The accident rate presented here is based on the number of accidents per 1,000 hours of training since this was done in Byrd Granger's book [1]. Appendix P of Granger's book showed that training accidents occurred at half the rate of those for active duty. The appendix also showed that women had fewer accidents than men by about 32 percent.
There were a total of 405 accidents involving 368 WASPs. One WASP had 4 accidents, one in training and the other three while in Tow Target, with no injury. Two WASPs had 3 accidents each with no injury. One of these two did not graduate. The other was on active duty for all three accidents but on three different assignments. Fifty-nine WASPs had 2 accidents involving 115 separate accidents.
For the trainees, there were 191 accidents involving 213 trainees. Nine trainees had 2 accidents, and only one of these suffered a minor injury. In terms of training phases, 8 of the double accidents occurred in primary, 6 in basic, and 4 in advanced training.
Listed in the table below, is a summary of the 405 WASP accidents, not injuries, from the 1945 AAF report [7]. These accidents are subdivided into Active Duty and Training and are grouped by plane type. There were 214 and 191 accidents, respectively. As discussed below, there is a loose correlation to number of hours flown and number of accidents for the training planes. But other factors affected the results also.
| PLANES | ACCIDENTS | ||||
|---|---|---|---|---|---|
| PLANE TYPE | MANUFACTURER | PLANE NAME | ACTIVE DUTY | TRAINING | TOTAL |
| A-24 (RA-24) | DOUGLAS | DAUNTLESS | 19 | 0 | 19 |
| AT-10 | BEECHCRAFT | WICHITA | 6 | 0 | 6 |
| AT-11 (AT-7, C-45, UC-45) | BEECHCRAFT | KANSAN | 14 | 0 | 14 |
| AT-17 (UC-78) | CESSNA | BOBCAT | 20 | 15 | 35 |
| AT-18 | LOCKHEED | HUDSON | 1 | 0 | 1 |
| AT-19 (UC-81) | STINSON-VULTEE | RELIANT | 3 | 0 | 3 |
| AT-6 (BC-1, AT-16) | NORTH AMERICAN | TEXAN | 34 | 88 | 122 |
| AT-9 | CURTISS | JEEP | 1 | 0 | 1 |
| B-17 | BOEING | FLYING FORTRESS | 3 | 0 | 3 |
| B-24 | CONSOLIDATED | LIBERATOR | 1 | 0 | 1 |
| B-25 (TB-25) | NORTH AMERICAN | MITCHELL | 2 | 0 | 2 |
| B-26 (AT-23, TB-26) | MARTIN | MARAUDER | 4 | 0 | 4 |
| BT-13 (BT-15) | VULTEE | VIBRATOR | 22 | 24 | 46 |
| C-47 | DOUGLAS | DAKOTA | 1 | 0 | 1 |
| L-2 | TAYLORCRAFT | GRASSHOPPER | 3 | 0 | 3 |
| L-3 | AERONCA | GRASSHOPPER | 2 | 0 | 2 |
| L-4 | PIPER | GRASSHOPPER | 2 | 0 | 2 |
| L-5 | STINSON-VULTEE | SENTINEL | 1 | 0 | 1 |
| L-6 | INTERSTATE | CADET | 1 | 0 | 1 |
| P-38 | LOCKHEED-VEGA | LIGHTNING | 1 | 0 | 1 |
| P-39 | BELL | AIRCOBRA | 8 | 0 | 8 |
| P-40 | CURTISS | WARHAWK | 9 | 0 | 9 |
| P-47 (RO-47) | REPUBLIC | THUNDERBOLT | 6 | 0 | 6 |
| P-51 | NORTH AMERICAN | MUSTANG | 11 | 0 | 11 |
| P-61 | NORTHROP | BLACK WIDOW | 2 | 0 | 2 |
| P-63 | BELL | KINGCOBRA | 4 | 0 | 4 |
| PQ-14 | CULVER | 6 | 0 | 6 | |
| PQ-8 | CULVER | KAYDET | 6 | 0 | 6 |
| PT-13 (PT-17, PT-18) | STEARMAN | KAYDET | 9 | 49 | 58 |
| PT-19 ( PT-26) | FAIRCHILD | CORNELL | 4 | 15 | 19 |
| PT-22 | RYAN | RECRUIT | 5 | 0 | 5 |
| RA-25 | CURTISS | HELLDIVER | 1 | 0 | 1 |
| R-37 (B-37) | LOCKHEED | LODESTAR | 1 | 0 | 1 |
| UC-64 | NOORDUYN | NORSEMAN | 1 | 0 | 1 |
| 32 PLANES OF 45 TOTAL | TOTALS | 214 | 191 | 405 | |
The next table shows the number of accidents, the estimated hours the plane was flown per student, and the injury category for just those aircraft used in training. As is shown by the estimated hours, there is a reasonable correlation of the number of accidents/injuries to hours flown. For example, the AT-17, or UC78, was used by the early classes where flying experience per pilot was highest. Then twin engine training was phased out early in the program as prior experience requirements dropped. Eventually, the BT-13 was also phased out of Basic training and the PT-19 was replaced by the PT-17. Both the UC-78 and BT-13 were replaced by the AT-6, which was used in both Basic and Advanced training. The end result was that the AT-6 was involved in 43 percent of the training accidents and flown twice as much as any other training plane. Contributing to this was that this plane was also used for cross-country training and thus longer periods of flying time were spent in it.
The glaring exception to this correlation is the PT-17. What probably accounts for this are two factors. This plane was used for primary training for the 1944 classes and the 1944 students had the least experience prior to entering the WASP program. Also of note is that the UC-78 often held more that two individuals, thus injuries are higher for fewer accidents.
The glaring exception to this correlation is the PT-17. What probably accounts for this are two factors. This plane was used for primary training for the 1944 classes and the 1944 students had the least experience prior to entering the WASP program. Also of note is that the UC-78 often held more that two individuals, thus injuries are higher for fewer accidents.
| TRAINING ACCIDENTS BY PLANE TYPE | ||||||||
|---|---|---|---|---|---|---|---|---|
| PLANES | INJURY TYPES | |||||||
| PLANE TYPE | TOT ACCIDENTS | EST HOURS | NONE | MINOR | MAJOR | FATALITY | TOTAL | PERCENT |
| AT-17 (UC-78) | 15 | 150-250 | 16 | 2 | 1 | 2 | 21 | 10% |
| PT-19 | 15 | 560-640 | 13 | 1 | 0 | 2 | 16 | 8% |
| BT-13 (BT-15) | 19 | 620-680 | 17 | 5 | 0 | 1 | 23 | 14% |
| PT-17 | 49 | 525-575 | 53 | 0 | 0 | 1 | 54 | 25% |
| AT-6 | 88 | 1375-1575 | 86 | 1 | 0 | 5 | 92 | 43% |
| Total | 191 | 190 | 10 | 2 | 11 | 213 | 100 | |
| Percent | 89.2% | 4.7% | 0.9% | 5.2% | 100% | |||
The previous two tables dealt with accidents as they relate to the planes that were involved in those accidents. The following table summarizes the actual injuries and loss of life that resulted from the 405 accidents. The number of trainees was based on the average for the three phases of training. The distribution of active duty personnel is extrapolated from Appendix P in Byrd Granger's book [1] which lists the duties of those WASP still on active duty on December 20, 1944, when the WASP were disbanded.
To relate the duties in Appendix P [1] to the missions specified in the 1945 accident report [7], the duties had to be reduced to two groups Ferrying and Other. The Other category included Tow Target, Operations, Transition, and post graduate training accidents.
As the table below shows, the accident rate is about three times higher on a per pilot basis for active duty that it was for training. This is more than what is shown in Appendix P [1]. This is because the rates in Granger's book are based on per 1,000 hours of flying, not number of pilots. Using the accident rates in Granger's book of 0.03 for training and 0.06 for active duty along with the number of injuries, minor and major only, the number of flying hours for training and active duty can be calculated. Respectively, the hours were 375,000 and 750,000. Thus if you take into account the greater number of hours the active duty WASP flew, their accident rate is lowered but still greater than that for training.
| WASP ACCIDENTS - INJURY RATE SUMMARY | |||||||
|---|---|---|---|---|---|---|---|
| STATUS | MISSION | MINOR | MAJOR | FATALITY | TOTAL | NO OF PILOTS | INJURY RATE |
| In Training | Primary | 1 | 0 | 3 | 4 | 1,823 | 0.2% |
| Basic | 6 | 1 | 2 | 9 | 1,309 | 0.7% | |
| Advanced | 3 | 1 | 6 | 10 | 1,074 | 0.9% | |
| Total | 10 | 2 | 11 | 23 | (avg) 1,402 | 1.6% | |
| Training % | 43% | 9% | 48% | ||||
| On Active Duty | Ferrying | 10 | 1 | 9 | 20 | 727 | 2.8% |
| All Other | 10 | 4 | 18 | 32 | 347 | 9.2% | |
| A. D. Total | 20 | 5 | 27 | 52 | 1,074 | 4.8% | |
| A. D. % | 38% | 10% | 52% | ||||
| Tot BT + AD | 30 | 7 | 38 | 75 | 2,497 | 3.0% | |
| BT + AD % | 40% | 9% | 51% | ||||
To relate training injuries to active duty injuries, the previous table based the accident rate on number of personnel in each group. The following chart looks only at the accidents, not injuries, and shows accident rates based on the hours accumulated by the trainees as they progress from phase to phase of training. This chart is the final result of laying out the schedule, trainee head count, training hours, and accidents over time. It shows how the accident rate of all classes varied over time relative to the phase of training.
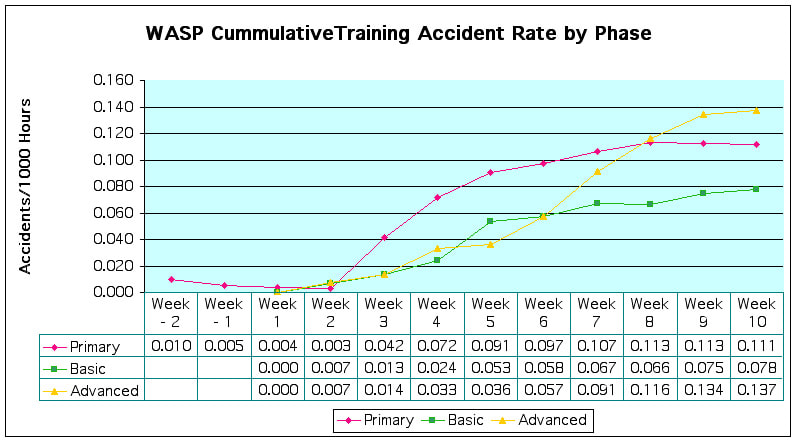
To create this chart, each class was separated by phase and each phase was right justified so that the last week of the phase for each class fell in 'week 10'. All earlier weeks lay to the left of week 10. The accident rate for each week and each class was calculated based on the cumulative accidents that occurred within each phase and on the cumulative hours for the students still in training since they started training. An average by week for all 18 classes was calculated for each phase to provide the data points on the chart.
Intuitively, it would seem that as training increased, the accident rate by phase should drop. The accumulated hours would increase for those fewer trainees that stayed in the program and accidents would decrease as experience increased. I believe this is especially true in a training environment where the process is more controlled and the students, being students, are naturally more cautious. This would not be the case for active duty pilots where there is less control and more variables.
Intuitively, it would seem that as training increased, the accident rate by phase should drop. The accumulated hours would increase for those fewer trainees that stayed in the program and accidents would decrease as experience increased. I believe this is especially true in a training environment where the process is more controlled and the students, being students, are naturally more cautious. This would not be the case for active duty pilots where there is less control and more variables.
|
This indeed was the case when comparing Primary to Basic training. Basic had an average accident rate that was 28 percent less than Primary. However, the average accident rate for Advanced exceeded both that of Basic and even Primary by 75 and 26 percent, respectively. These differences are based on the right hand end points of the graphs, which represent a moving average for all accidents by the end of the phase.
|
For the Advanced phase accident rate to deviate from the expected, the number of Advanced phase accidents increased at a faster rate than the training hours. In fact, the accumulation of hours was actually slowing as trainees were dropped from the program. So, for the accident rate to follow the expected drop, the number of accidents would have to drop by a still faster rate. Instead, as training hours dropped by 25 percent, accidents increased by 102 percent.
| TRAINING ACCIDENT RATE SUMMARY | ||||
|---|---|---|---|---|
| PRIMARY | BASIC | ADVANCED | TOTAL | GRADUATE |
| 0.112 | 0.080 | 0.139 | 0.210 | 0.144 |
In addition to the higher accident rate for the Advanced phase, over half of the fatalities during training occurred during this phase. However, to keep this in perspective, refer to the Phase/Accident/Injury table. The fatality rate for the Advanced phase was only slightly higher than it was for Primary and Basic relative to the total accidents - Primary : 4.8 percent, Basic : 4.1 percent, Advanced : 5.9 percent.
In trying to understand the significant increase in the accident rate for the Advanced phase, I observed a possibility - more flying hours in less time. However, due to lack of detail, this may be only a piece of the puzzle. The average number of weeks spent in each phase by all the classes was calculated. There were 9.4 weeks for Primary, 8.9 weeks for Basic, and 8.2 for Advanced. So, there was more than a week less time for completing the flying hours of Advance training. This is also shown by the schedule for 43-3.
|
In addition, over 60 percent of the accidents in the Advance phase occurred during the last four weeks of the shorter schedule. Graduation was approaching and training needed to be completed.
Also, in looking at the individual classes for the Advanced phase, there was one class in which 9 accidents (The Advanced phase class average was 4.9.) occurred in the last 5 weeks of a 6 week Advanced phase schedule. Luckily, none of these 9 accidents resulted in an injury or fatality. This class also had the least amount of training, 455 hours per student, and was the largest class of all 18. |
OTHER ACCIDENT FACTORS AND FACTS:
To start with, there are 7 unknown WASP trainees. The difference between 1,830 women admitted into the WASP program, and 1,074 women that graduated as military pilots is 756. On the other hand, if you take the list of graduate names and the list of trainee names available from various sources and add those two lists of names together, you get a total of 1,823 names. There are seven women who entered the program, but who's names were lost. This is also documented in footnotes in Appendix A of Byrd Granger's book [1].
In table 10 of Granger's book [1], there is a summary for the causes of all training and active duty accidents. She lists 23 causes and groups them into 4 categories: Aircraft, Pilot Error, Other Personnel, and Miscellaneous. The distribution of causes between those four categories were 57 percent, 30 percent, 11 percent, and 2 percent, respectively. The top cause in each category was miscellaneous flight controls (17.1 percent), aircraft proficiency (8.5 percent), instructors (4.3 percent), and airport terrain (1.2 percent).
As shown in the Average Accident Rate table above, the WASP graduates had an accident rate that was 31 percent lower that all the classes as hole.
The worst week for an individual probably goes to one trainee who had 3 accidents over a 6 day period in May of 1944. There were no injuries, but she did not graduate with the rest of her class.
|
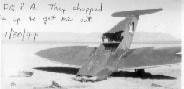
There were two weeks during training in which nine accidents occurred. During the week of January 17, 1944, four of the 6 classes in training had at least one accident. Ten trainees were involved and one class contributed to 4 of the accidents with 5 trainees. Fortunately, there were no injuries. During the week of June 12, 1944, there were also nine accidents. All six classes were involved. Again there were ten trainees involved. Unfortunately, this time one trainee was killed. Marjorie D. Edwards was less than a month from graduation and on a cross-country training flight when she had engine trouble and had to bail out. However, the plane was too low. June, 1944, was also the worst month of the 27 months that the WASP program spanned. There were 33 accidents and two trainees and three graduates were killed. RELATED WEB PAGES: |
|
My initial interests in WASP accidents started in October, 1996, when I received a message from Robert Staggs, a witness to the accident that killed WASP Bonnie Jean Welz. About a year later, I completed my web pages on the 38 WASPs that were killed during their service to the United States. In July, 1998, I received another message from Walt Witherspoon concerning the accidents of Gertrude Tompkins and Marie Mitchell. About a year after that, July, 1999, and with the help of Walt, who provided a copy of Gertrude's accident report, I summarized Gertrude's disappearance. I was further inspired to the provide details of the Bonnie Jean Welz accident in October of 1999. A little more than a year later, another aircraft accident researcher, Craig Fuller, found my web site and contacted me. Shortly after that, I had copies of all 38 accident reports for the WASPs who were killed in service. In May, 2001, I summarized the accident of Mabel Rawlinson from class 43-3. Since this page was first posted, I have also added a summary of the accidents for the eleven WASP fatalities in training.
REFERENCES:
1. ON FINAL APPROACH, Byrd Howell Granger of class 43-1, 1991, A source of hundreds of technical details about the WASPs.
2. WHO WERE THE WASP - A WORLD WAR II RECORD, Doris Brinker Turner class of 44-9, 1989, reprints of the Fifinella Gazette and The Avenger WASP training newsletters.
3. OUT OF THE BLUE AND INTO HISTORY, Betty Stagg Turner, 2001, Biographies of 637 former WASPs.
4. WOMEN PILOTS OF WORLD WAR II, Jean Hascall Cole of class 44-2, Forward by Dora Dougherty Strother of class 43-3, Histories of 34 members of class 44-2.
5. CLIPPED WINGS - THE RISE AND FALL OF THE WOMEN AIRFORCE SERVICE PILOTS (WASPs) OF WORLD WAR II, Molly Merryman, 1998.
6. Seventy-eight Army Air Force Accident Reports, used to identify when some training phases started or stopped, which class a student was in if it was different from their graduation class, or determine other details about a group of accidents.
7. ARMY ACCIDENTS INVOLVING WASP PERSONNEL - November 1942 through December 1944, SC-SS-897, Statistical Control Division, Office of Management Control, April 6, 1945.
8. LADYBIRDS, Henry M. Holden, 1991, The Untold Story of Women Pilots in America.
9. THE WASP TRAINING PROGRAM, Dora Dougherty, 1974, American Aviation Historical Society Journal, Vol 19, page 298.
10. Letter, October 31, 2004, Astrid Robillard-Johnson.
MANY THANKS:
My thanks to the following individuals who contributed to this effort
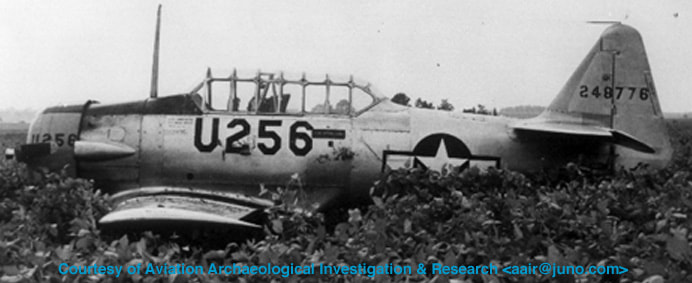
Craig Fuller - Craig, of Aviation Archaeological Investigation & Research, provided many of the accident reports [6] and the accident report summary [7].
John Teer - John is the son of Shirely Slade Teer of class 43-5. John is also a pilot and gave me much to think about after reviewing the first polished draft of this page.
Pat Jernigan, Ret. Col. U. S. Army - Pat is also researching WASP accidents as a part of her effort to have all graduate WASPs classified as officers by the Department of Defense. The WASP have veteran status, but are not classified as officers. Pat has provided copies of 222 additional WASP accident reports.
REVISION HISTORY:
March 22, 2003 - Added new accident image and link to new page on the 11 WASP that died in training. Added new table based on log books for Lois B Hailey.
June 18, 2003 - Added chart showing training hours and all accidents for the length of the program
July 17, 2003 - Updated results based on 10 additional accident reports. One training accident report altered which WASP class was credited for one accident, and a new active duty accident report, which was previously unknown, was added to the results and affected two tables for active duty accidents. Total accidents increased to 404. The accident rate chart was updated.
July 22, 2003 - Added quote from writings of Lois B. Hailey to the RISKING THEIR LIVES section.
July 24, 2003 - Updated tables to adjust training accident counts. What was initially thought to be one accident and one plane, was really two accidents and two planes. This affected the accident count for the UC-78 and Advanced training phase. Total accidents increased to 405.
November 15, 2004 - Added text relative to new reference [10].
(Copyright © CAHailey, 2003-2010, All rights reserved, Request Permission to Use)